Command line tools
biota was initially developed as a tool for use in Python. However, command line functionalities are available to download data and produce outputs of:
- Calibrated gamma0 backscatter
- Forest cover
- Aboveground biomass
- Aboveground biomass change
- Classified forest change types (i.e. deforestation, degradation etc.)
These are available through the command line tool biota.
Getting ALOS mosaic data
Data from the ALOS mosaic product can be accessed from JAXA through a graphical interface online after signing up. The data is delivered in either 1x1 degree tiles or 5x5 degree collections of tiles (recommended).
To obtain national-scale data using the web interface is possible, but for large-scale applications biota contains a command line interface to automate the download and decompression process. download.py takes latitude, longitude and years as inputs, and returns a downloaded an decompressed and ready-to-use product in a format the biota will understand.
The biota tool includes a script to download ALOS mosaic tiles directly from the JAXA FTP server. The user specifies either a 1x1 or 5x5 degree tile by its upper-left corner latitude and longitude and a year or set of years. The downloader handles access of both the older ALOS-1 filename structure and the ALOS-2 filename structure. The script also optionally decompress images after download.
Help for download.py can be viewed by typing biota download --help:
usage: download.py [-h] [-lat DEG] [-lon DEG] [-l] [-y Y [Y ...]] [-o DIR]
                [-r]

Download ALOS-1/2 data from JAXA, specifying a particular year and
latitude/longitude.

Required arguments:
-lat DEG, --latitude DEG
                        Latitude of tile upper-left corner.
-lon DEG, --longitude DEG
                        Longitude of tile upper-left corner.

Optional arguments:
-l, --large           Download large tiles. ALOS mosaic tiles are available
                        in 1x1 or 5x5 degree tiles. If downloading large
                        volumes of data, it's usually better to use the
                        latter. If this option is chosen, you must select a
                        lat and lon that's a multiple of 5 degrees.
-y Y [Y ...], --years Y [Y ...]
                        Year of data to download. Defaults to downloading all
                        data.
-o DIR, --output_dir DIR
                        Optionally specify an output directory. Defaults to
                        the present working directory.
-r, --remove          Optionally remove downloaded .tar.gz files after
                        decompression.
For example, to download data for the 1x1 tile at 38 degrees longitude and -8 degrees latitude for the years 2007 and 2010, input:
biota download -lon 38 -lat -8 -y 2007 2010
To download all tiles for the 5x5 degree area (recommended) covering 35 - 40 degrees longitude and -5 - -10 degrees latitude for the years 2007 and 2010, input:
biota download -lon 35 -lat -5 --large -y 2007 2010
To specify an output directory, we can use the -o option:
biota download -lon 38 -lat -8 -y 2007 2010 -o /path/to/output_dir
ALOS mosaic data are delivered as compressed files, which biota will decompress. To remove the original files after decompression, use the -r flag:
biota download -lon 38 -lat -8 -y 2007 2010 -r
Mapping vegetation properties
The biota tool features a command line option to produce a raster of vegetation properties for a given year. The user specifies the directory where the data are stored, then specifies the designated location and year like for the download. The user may choose to produce rasters for any or all of the following properties: Gamma0, Aboveground Biomass, Woody Cover. Filtering, downsampling and options specific to each property are available.
Help for this functionality can be viewed by typing biota property --help or biota property -h:
usage: property.py [-h] [-dir DIR] [-lat DEG] [-lon DEG] [-y Y [Y ...]]
                                   [-o {Gamma0,AGB,WoodyCover,all}] [-nf] [-ds N] [-od DIR]
                                   [-v] [-p POL] [-u units] [-ft tC/ha] [-at ha]

Process ALOS-1/2 mosaic data to prpoduce estimates of forest cover and
biomass.

Required arguments:
  -dir DIR, --data_directory DIR
                                                Path to directory containing ALOS mosaic data.
  -lat DEG, --latitude DEG
                                                Latitude of tile to process (upper-left corner).
  -lon DEG, --longitude DEG
                                                Longitude of tile to process (upper-left corner).
  -y Y [Y ...], --years Y [Y ...]
                                                Years of data to process.

Optional arguments:
  -o {Gamma0,AGB,WoodyCover,all}, --output {Gamma0,AGB,WoodyCover,all}
                                                Choose which kind of output you want. Defaults to all
                                                possible outputs.
  -nf, --nofilter       Use this flag if you don't want to apply a speckle
                                                filter.
  -ds N, --downsample_factor N
                                                Apply downsampling to inputs by specifying an integer
                                                factor to downsample by. Defaults to no downsampling.
  -od DIR, --output_dir DIR
                                                Optionally specify an output directory. Defaults to
                                                the present working directory.
  -v, --verbose         Print progress to terminal. Defaults to False.

Output-specific arguments:
  -p POL, --polarisation POL
                                                If you have selected Gamma0 as an output, choose the
                                                polarisation. Defaults to HV.
  -u units, --units units
                                                If you have selected Gamma0 as an output, choose the
                                                outputs units. Defaults to 'natural' units.
  -ft tC/ha, --forest_threshold tC/ha
                                                If you have selected WoodyCover as an output, choose
                                                the miminum forest biomass threshold. Defaults to 10
                                                tC/ha.
  -at ha, --area_threshold ha
                                                If you have selected WoodyCover as an output, choose
                                                the minimum forest area threshold. Defaults to 0 ha.

        usage: property.py [-h] [-dir DIR] [-lat DEG] [-lon DEG] [-y Y [Y ...]]
                                                   [-o {Gamma0,AGB,WoodyCover,all}] [-lf] [-ds FACTOR]
                                                   [-od DIR] [-pz {HV,HH,VH,VV}] [-ft THRESHOLD]
                                                   [-at THRESHOLD]
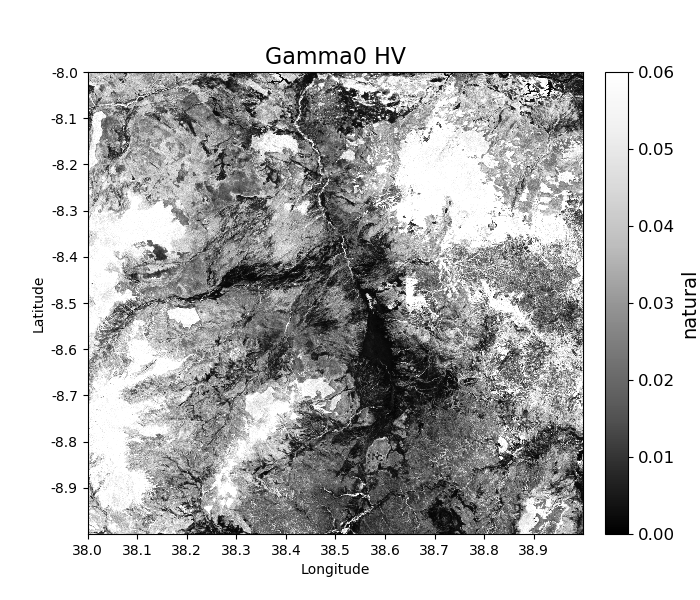
Gamma0 backscatter
For example, to produce a calibrated image of Gamma0 backscatter for the HV polarisation for the downloaded 1x1 tile at 38 degrees longitude and -8 degrees latitude for the year 2007, run:
biota property -dir /path/to/data/ -lon 38 -lat -8 -y 2007 -o Gamma0
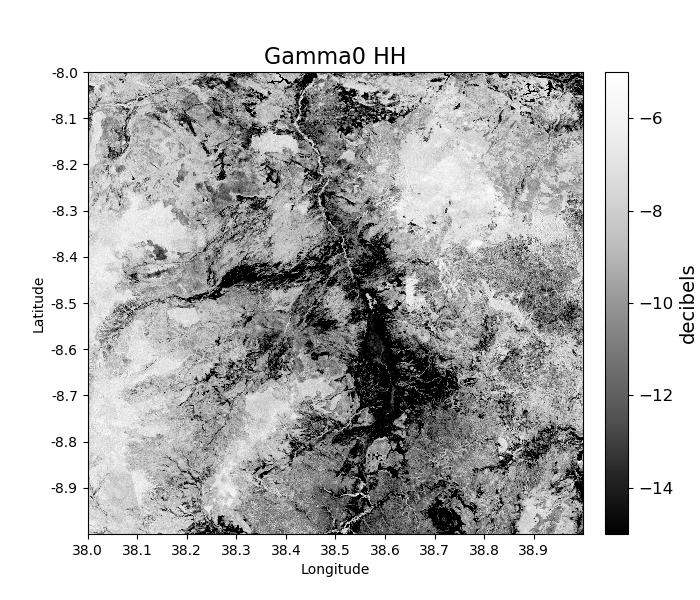
To produce the same image, but using the HH polarisation and with units of decibels:
biota property -dir /path/to/data/ -lon 38 -lat -8 -y 2007 -o Gamma0 -u decibels -p HH
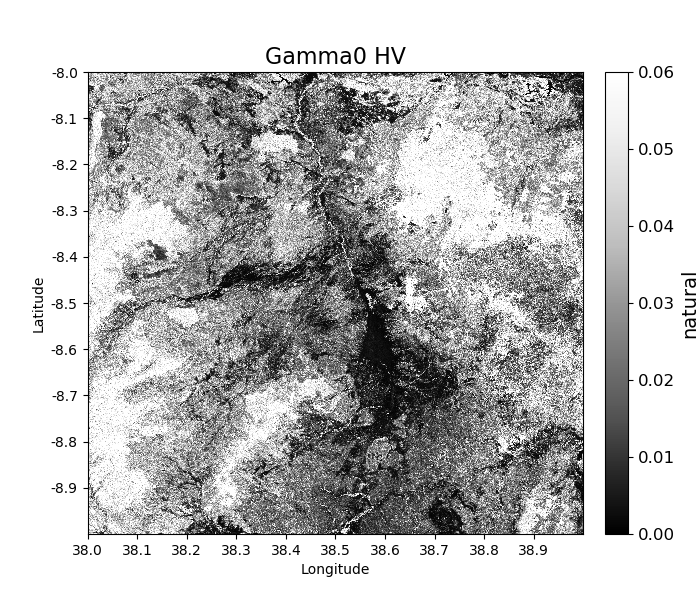
If you prefer not to apply a speckle filter:
biota property -dir /path/to/data/ -lon 38 -lat -8 -y 2007 -o Gamma0 --nofilter
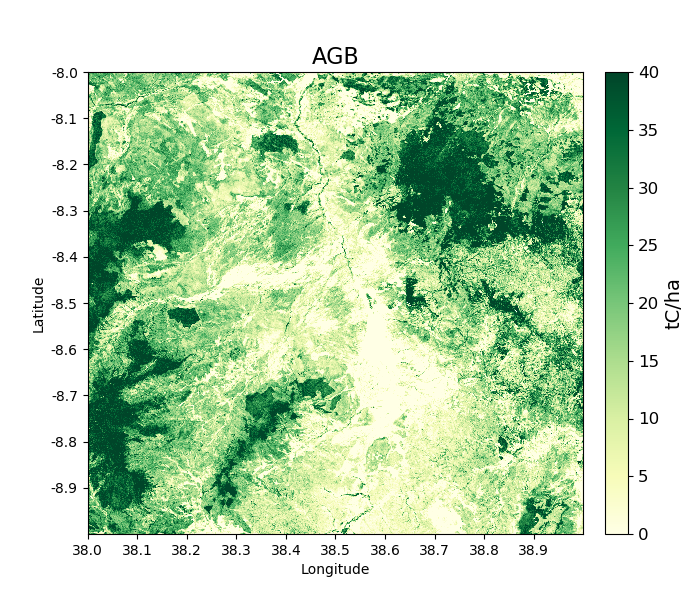
Aboveground biomass
To produce a map of aboveground biomass (based on a generic southern African biomass-backscatter model, in units of tC/ha) for the same tile run:
biota property -dir /path/to/data/ -lon 38 -lat -8 -y 2007 -o AGB
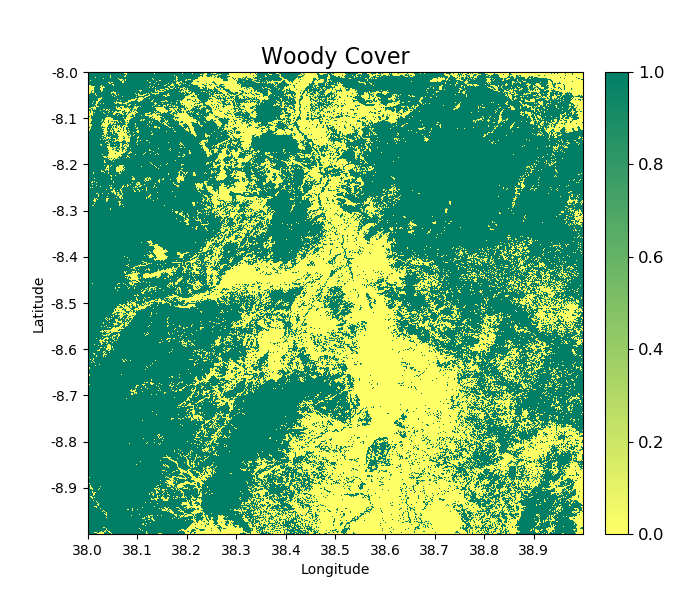
Woody cover
biota can also be used to produce a map of forest cover (or woody cover), based on a threshold of biomass. By default the 10 tC/ha threshold separates forest from nonforest.
To produce a map of woody cover run:
biota property -dir /path/to/data/ -lon 38 -lat -8 -y 2007 -o WoodyCover
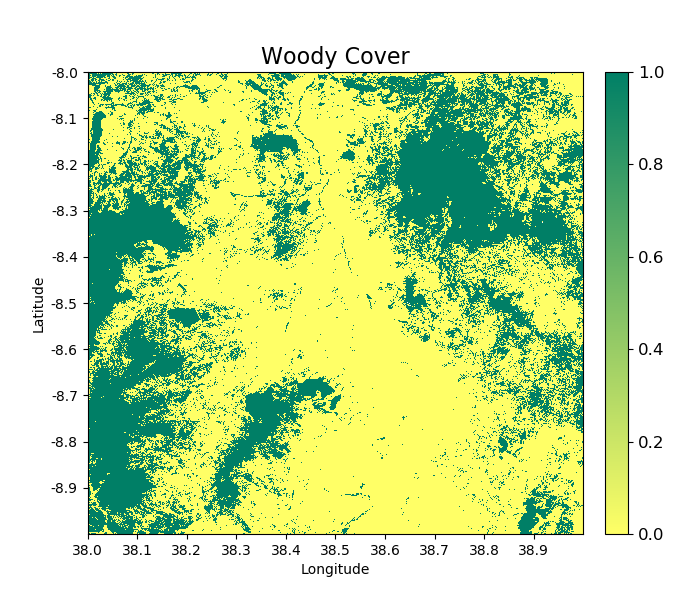
To use a custom forest/non-forest threshold (e.g. 20 tC/ha), use the -ft option:
biota property -dir /path/to/data/ -lon 38 -lat -8 -y 2007 -o WoodyCover -ft 20

Forest definitions often contain a minimum area threshold (e.g. a forest patch must be greater than 1 ha in size) to be counted as forest. To also add a minimum area threshold with biota use the -at option:
biota property -dir /path/to/data/ -lon 38 -lat -8 -y 2007 -o WoodyCover -ft 20 -at 1
Producing vegetation change rasters
The biota tool features a command line option to produce a raster of vegetation change between two given years. The user specifies the directory where the data are stored, then specifies the designated location and two years to compare.
Help for this functionality can be viewed by typing biota change --help or biota change -h:
usage: change.py [-h] [-dir DIR] [-lat DEG] [-lon DEG] [-y1 YR] [-y2 YR]
                                 [-o {AGBChange,ChangeType,all}] [-nf] [-ds N] [-od DIR] [-v]
                                 [-ct ha] [-mt tC/ha] [-it PC] [-ft tC/ha] [-at ha]

Process ALOS-1/2 moasic data to output biomass and woody cover change between
2 years.

Required arguments:
  -dir DIR, --data_directory DIR
                                                Path to directory containing ALOS mosaic data.
  -lat DEG, --latitude DEG
                                                Latitude of tile to process (upper-left corner).
  -lon DEG, --longitude DEG
                                                Longitude of tile to process (upper-left corner).
  -y1 YR, --year1 YR    First year of data to process.
  -y2 YR, --year2 YR    Second year of data to process.

Optional arguments:
  -o {AGBChange,ChangeType,all}, --output {AGBChange,ChangeType,all}
                                                Choose which kind of output you want. Defaults to all
                                                possible outputs.
  -nf, --nofilter       Use this flag if you don't want to apply a speckle
                                                filter.
  -ds N, --downsample_factor N
                                                Apply downsampling to inputs by specifying an integer
                                                factor to downsample by. Defaults to no downsampling.
  -od DIR, --output_dir DIR
                                                Optionally specify an output directory. Defaults to
                                                the present working directory.
  -v, --verbose         Print progress to terminal. Defaults to False.

Output-specific arguments:
  -ct ha, --change_area_threshold ha
                                                If you have selected ChangeType as an output, choose a
                                                threshold for a minimum change in forest area required
                                                to be flagged as a change. Defaults to 0 ha.
  -mt tC/ha, --change_magnitude_threshold tC/ha
                                                If you have selected ChangeType as an output, choose
                                                the minimum absolute change in biomass to be flagged
                                                as a change. Defaults to 0 tC/ha.
  -it PC, --change_intensity_threshold PC
                                                If you have selected ChangeType as an output, choose
                                                the minimum relative change in biomass to be flagged
                                                as a change. Defaults to 0 percent.
  -ft tC/ha, --forest_threshold tC/ha
                                                If you have selected ChangeType as an output, choose
                                                the miminum forest biomass threshold in each input
                                                image. Defaults to 10 tC/ha.
  -at ha, --area_threshold ha
                                                If you have selected ChangeType as an output, choose
                                                the minimum forest area threshold in each input image.
                                                Defaults to 0 ha.
AGB Change
biota can produce estimates of AGB change
To produce a map of biomass change for the downloaded 1x1 tile at 38 degrees longitude and -8 degrees latitude between 2007 and 2010, run:
biota change -dir /path/to/data/ -lon 38 -lat -8 -y1 2007 -y2 2010 -o AGBChange

Change detection
Changes in AGB are classified based on a series of thresholds:
| Threshold | Description |
forest_threshold |
The minimum AGB that defines a forest area (tC/ha). |
change_area_threshold |
The minimum area over which a change must occurr (ha). |
change_magnitude_threshold |
The minimum absolute change of AGB that defines a change event (tC/ha). |
change_intensity_threshold |
The minimum proportional change of AGB that defines a change event (0-1). |
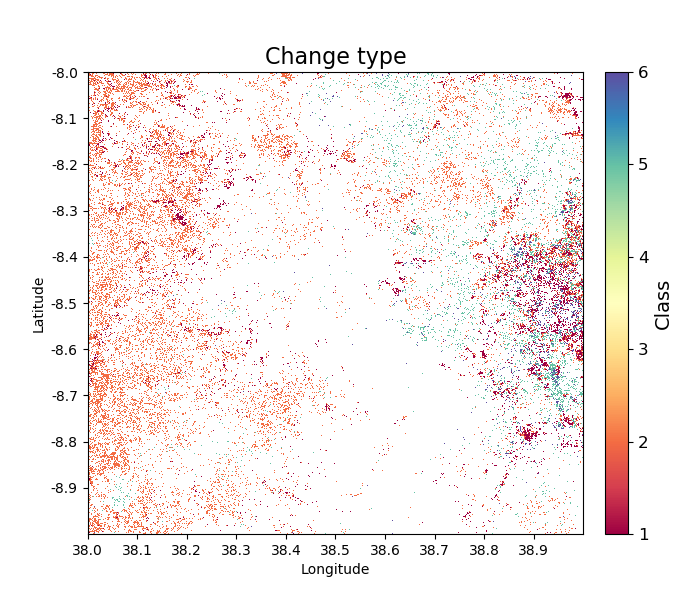
There are 7 change types described in biota, each of which is defined as a number 0 to 6 in the output GeoTiff. Change types are:
| Change class | Pixel value | Description |
| Deforestation | 1 | A loss of AGB from that crosses the forest_threshold. |
| Degradation | 2 | A loss of AGB in a location above the forest_threshold in both images. |
| Minor Loss | 3 | A loss of AGB that does not cross the change_area_threshold, change_magnitude_threshold, or change_intensity_threshold. |
| Minor Gain | 4 | A gain of AGB that does not cross the change_area_threshold, change_magnitude_threshold, or change_intensity_threshold. |
| Growth | 5 | A gain of AGB in a location above the forest_threshold in both images. |
| Aforestation | 6 | A gain of AGB that crosses the forest_threshold. |
| Nonforest | 0 | Below forest_threshold in both images. |
To identify change types with default parameters, use:
biota change -dir /path/to/data/ -lon 38 -lat -8 -y1 2007 -y2 2010 -o ChangeType

To apply a minimum area of 1 hectare for a given change:
biota change -dir /path/to/data/ -lon 38 -lat -8 -y1 2007 -y2 2010 -o ChangeType -ct 1
To also apply a minimum absolute change threshod of 5 tC/ha:
biota change -dir /path/to/data/ -lon 38 -lat -8 -y1 2007 -y2 2010 -o ChangeType -ct 1 -mt 5

To also apply a minumum relative change threshold of 25 % of biomass change:
biota change -dir /path/to/data/ -lon 38 -lat -8 -y1 2007 -y2 2010 -o ChangeType -ct 1 -mt 5 -it 25

Change detection recipes
To produce high-quality estimates of change, the user will need to carefully define the multiple parameters determing change parameters based on experimentation and ecological knowledge. Some recipes that have worked well for us include the following.
For production of deforestation estimates in Zimbabwe:
biota change -dir /path/to/data/ -lon 38 -lat -8 -y1 2007 -y2 2010 -o ChangeType -ct 1 -it 25
More recipes to follow after the Nairobi SMFM workshop (11th - 15th March 2019).